[GUIDE] How to Check Your All-Time Progress in Your Brokerage Account
Post published on 9th January 2026 at 8:04 PM by admin.
You can click on the image guide above to enlarge it and you will able to zoom in as well.
Please follow the image guide above to check how your connected Brokerage T account is doing. It is important to filter the analytics reports by customizing the date ranges to only start from the date when you first subscribed to our service.
If you have any locked positions or positions of your own during your subscription, these positions will influence the results of the analytics reports.
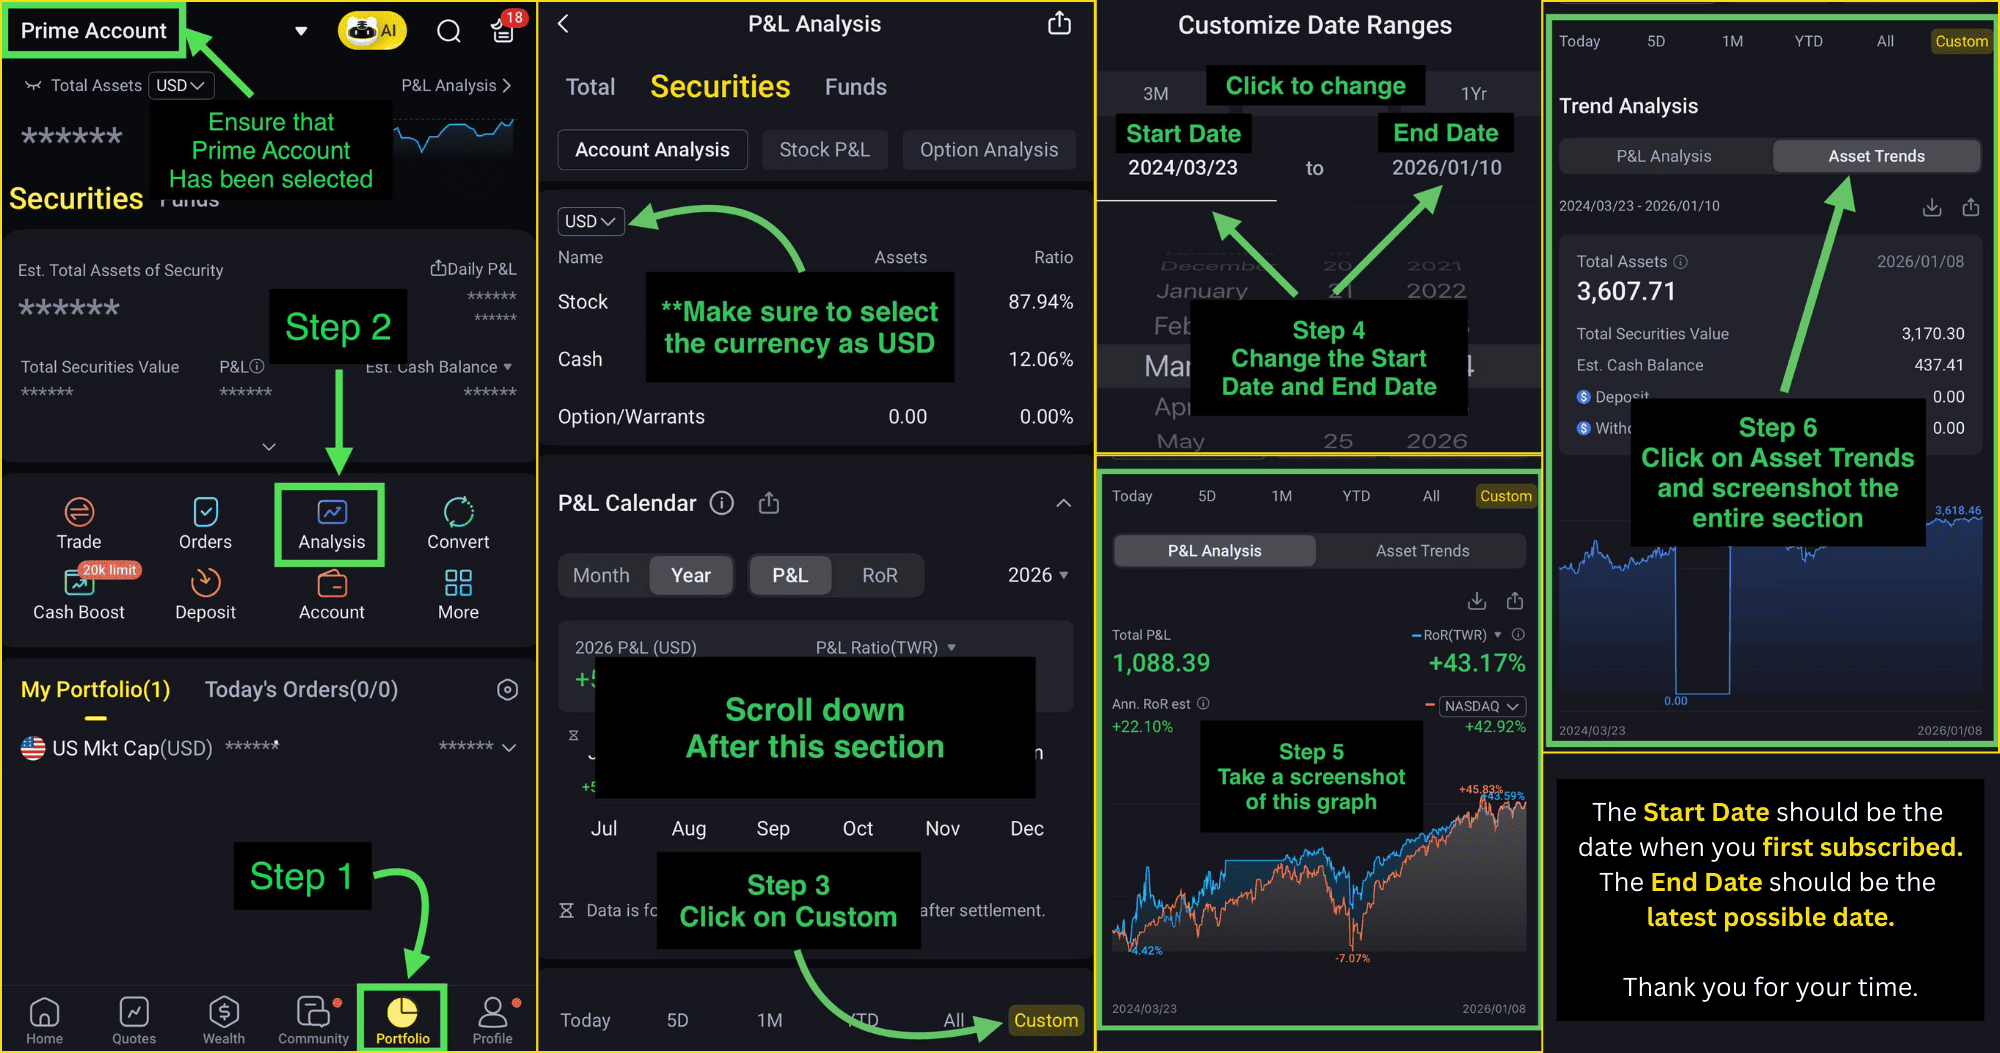
Step 1:
Open your Brokerage T mobile application on your phone. Click on the "Portfolio" icon located at the bottom right of your screen (beside the "Profile" icon).
Step 2:
At the top left of your screen, please ensure that you have selected your Prime Account and it should say "Prime Account" as shown in our image guide above.
Please click on the "Analysis" purple icon near to the center of your screen.
Step 3:
Please ensure that the currency at the top of your screen is selected as USD.
Scroll down to the section below the P&L Calendar section.
Click on the "Custom" button/text as shown in our image guide.
Step 4:
You are able to filter the period of your analytics reports in this step.
Your "Start Date" should be the date when you first subscribed to tradewithstan (or otherwise instructed).
Your "End Date" should be the latest possible date (or otherwise instructed).
Please note that the date format is YEAR/MONTH/DAY. Example: 05 Jan 2026 will be 2026/01/05.
Step 5:
This graph shows your P&L Percentage throughout your subscription along with your actual P&L amount, P&L Percentage (RoR) and Estimated annual P&L Percentage figures.
Take a screenshot of this graph as shown in our image guide (please ensure the dates are visible as well) and send it to us on WhatsApp by clicking here.
Step 6:
Please click on "Asset Trends" tab as shown in the image guide above.
This graph shows your NLV/Total Assets throughout your subscription along with Total Securities Value, Deposit and Withdrawals.
The Deposit and Withdrawal figures are not working so you may ignore them.
Take a screenshot of this graph as shown in our image guide (please ensure the dates are visible as well) and send it to us on WhatsApp by clicking here.
You can click on the image guide above to enlarge it and you will able to zoom in as well.
Please follow the image guide above to check how your connected Brokerage M account is doing. It is important to filter the analytics reports by customizing the date ranges to only start from the date when you first subscribed to our service.
If you have any locked positions or positions of your own during your subscription, these positions will influence the results of the analytics reports.
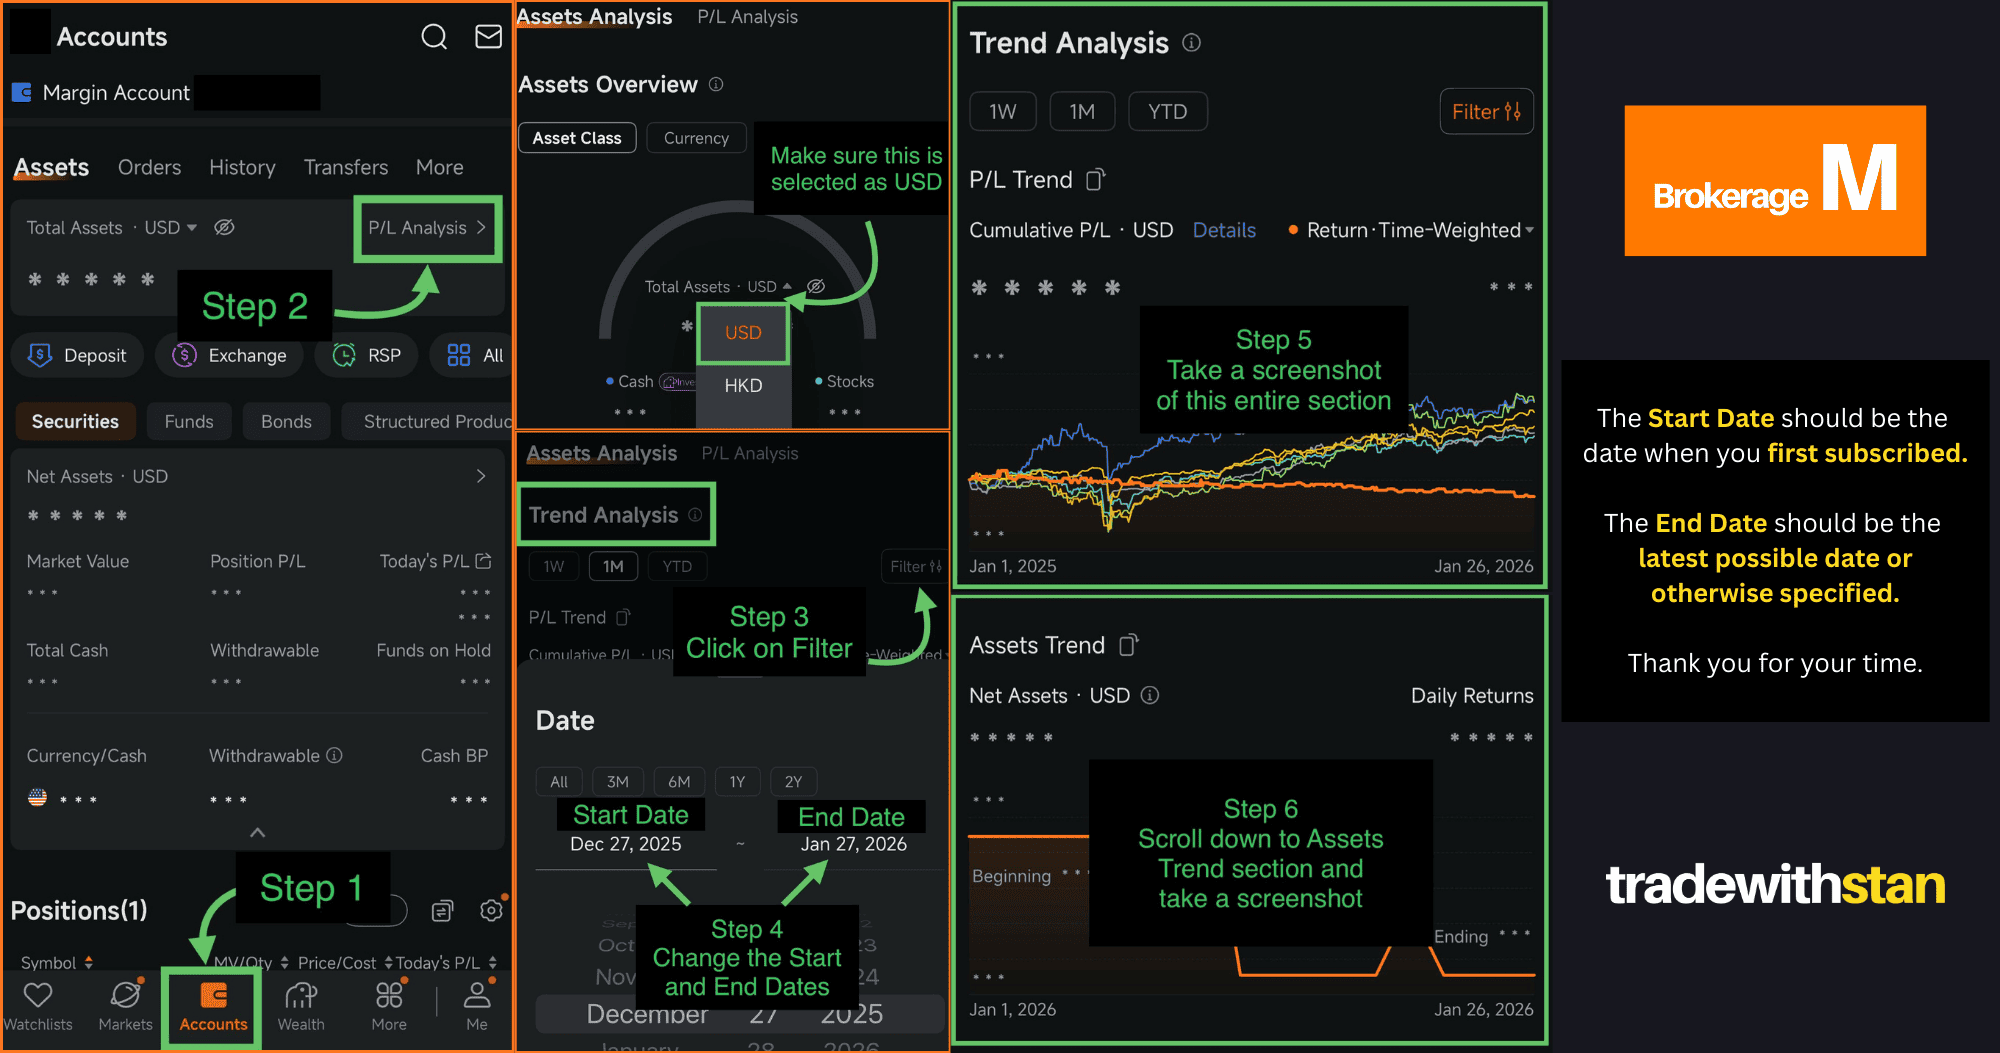
Step 1:
Open your Brokerage M mobile application on your phone. Click on the "Accounts" icon located at the bottom of your screen (beside the "Markets" icon).
Step 2:
Click on the "P/L Analysis" text near to the top right of your screen beside the "Total Assets" text.
Step 3:
Please ensure that the currency beside "Total Assets" is selected as USD.
Scroll down to the section called "Trend Analysis".
Click on the "Filter" button/text as shown in our image guide.
Step 4:
You are able to filter the period of your analytics reports in this step.
Your "Start Date" should be the date when you first subscribed to tradewithstan (or otherwise instructed).
Your "End Date" should be the latest possible date (or otherwise instructed).
Step 5:
This graph shows your P&L Percentage throughout your subscription along with your actual P&L amount and P&L Percentage (Time Weighted) figures.
Take a screenshot of this graph as shown in our image guide (please ensure the dates and P/L figures are visible as well) and send it to us on WhatsApp by clicking here.
Step 6:
Scroll down further to the section called "Assets Trend".
This graph shows your NLV/Total Assets throughout your subscription along with Total Securities Value, Deposit and Withdrawals.
Any deposits or withdrawals will affect this graph.
Take a screenshot of this graph as shown in our image guide (please ensure the dates and figures are visible as well) and send it to us on WhatsApp by clicking here.
Click Here For Brokerage T Guide
You can click on the image guide above to enlarge it and you will able to zoom in as well.
Please follow the image guide above to check how your connected Brokerage T account is doing. It is important to filter the analytics reports by customizing the date ranges to only start from the date when you first subscribed to our service.
If you have any locked positions or positions of your own during your subscription, these positions will influence the results of the analytics reports.
Steps to View All-Time Analytics Reports For Brokerage T
Step 1:
Open your Brokerage T mobile application on your phone. Click on the "Portfolio" icon located at the bottom right of your screen (beside the "Profile" icon).
Step 2:
At the top left of your screen, please ensure that you have selected your Prime Account and it should say "Prime Account" as shown in our image guide above.
Please click on the "Analysis" purple icon near to the center of your screen.
Step 3:
Please ensure that the currency at the top of your screen is selected as USD.
Scroll down to the section below the P&L Calendar section.
Click on the "Custom" button/text as shown in our image guide.
Step 4:
You are able to filter the period of your analytics reports in this step.
Your "Start Date" should be the date when you first subscribed to tradewithstan (or otherwise instructed).
Your "End Date" should be the latest possible date (or otherwise instructed).
Please note that the date format is YEAR/MONTH/DAY. Example: 05 Jan 2026 will be 2026/01/05.
Step 5:
This graph shows your P&L Percentage throughout your subscription along with your actual P&L amount, P&L Percentage (RoR) and Estimated annual P&L Percentage figures.
Take a screenshot of this graph as shown in our image guide (please ensure the dates are visible as well) and send it to us on WhatsApp by clicking here.
Step 6:
Please click on "Asset Trends" tab as shown in the image guide above.
This graph shows your NLV/Total Assets throughout your subscription along with Total Securities Value, Deposit and Withdrawals.
The Deposit and Withdrawal figures are not working so you may ignore them.
Take a screenshot of this graph as shown in our image guide (please ensure the dates are visible as well) and send it to us on WhatsApp by clicking here.
Click Here For Brokerage M Guide
You can click on the image guide above to enlarge it and you will able to zoom in as well.
Please follow the image guide above to check how your connected Brokerage M account is doing. It is important to filter the analytics reports by customizing the date ranges to only start from the date when you first subscribed to our service.
If you have any locked positions or positions of your own during your subscription, these positions will influence the results of the analytics reports.
Steps to View All-Time Analytics Reports For Brokerage M
Step 1:
Open your Brokerage M mobile application on your phone. Click on the "Accounts" icon located at the bottom of your screen (beside the "Markets" icon).
Step 2:
Click on the "P/L Analysis" text near to the top right of your screen beside the "Total Assets" text.
Step 3:
Please ensure that the currency beside "Total Assets" is selected as USD.
Scroll down to the section called "Trend Analysis".
Click on the "Filter" button/text as shown in our image guide.
Step 4:
You are able to filter the period of your analytics reports in this step.
Your "Start Date" should be the date when you first subscribed to tradewithstan (or otherwise instructed).
Your "End Date" should be the latest possible date (or otherwise instructed).
Step 5:
This graph shows your P&L Percentage throughout your subscription along with your actual P&L amount and P&L Percentage (Time Weighted) figures.
Take a screenshot of this graph as shown in our image guide (please ensure the dates and P/L figures are visible as well) and send it to us on WhatsApp by clicking here.
Step 6:
Scroll down further to the section called "Assets Trend".
This graph shows your NLV/Total Assets throughout your subscription along with Total Securities Value, Deposit and Withdrawals.
Any deposits or withdrawals will affect this graph.
Take a screenshot of this graph as shown in our image guide (please ensure the dates and figures are visible as well) and send it to us on WhatsApp by clicking here.